


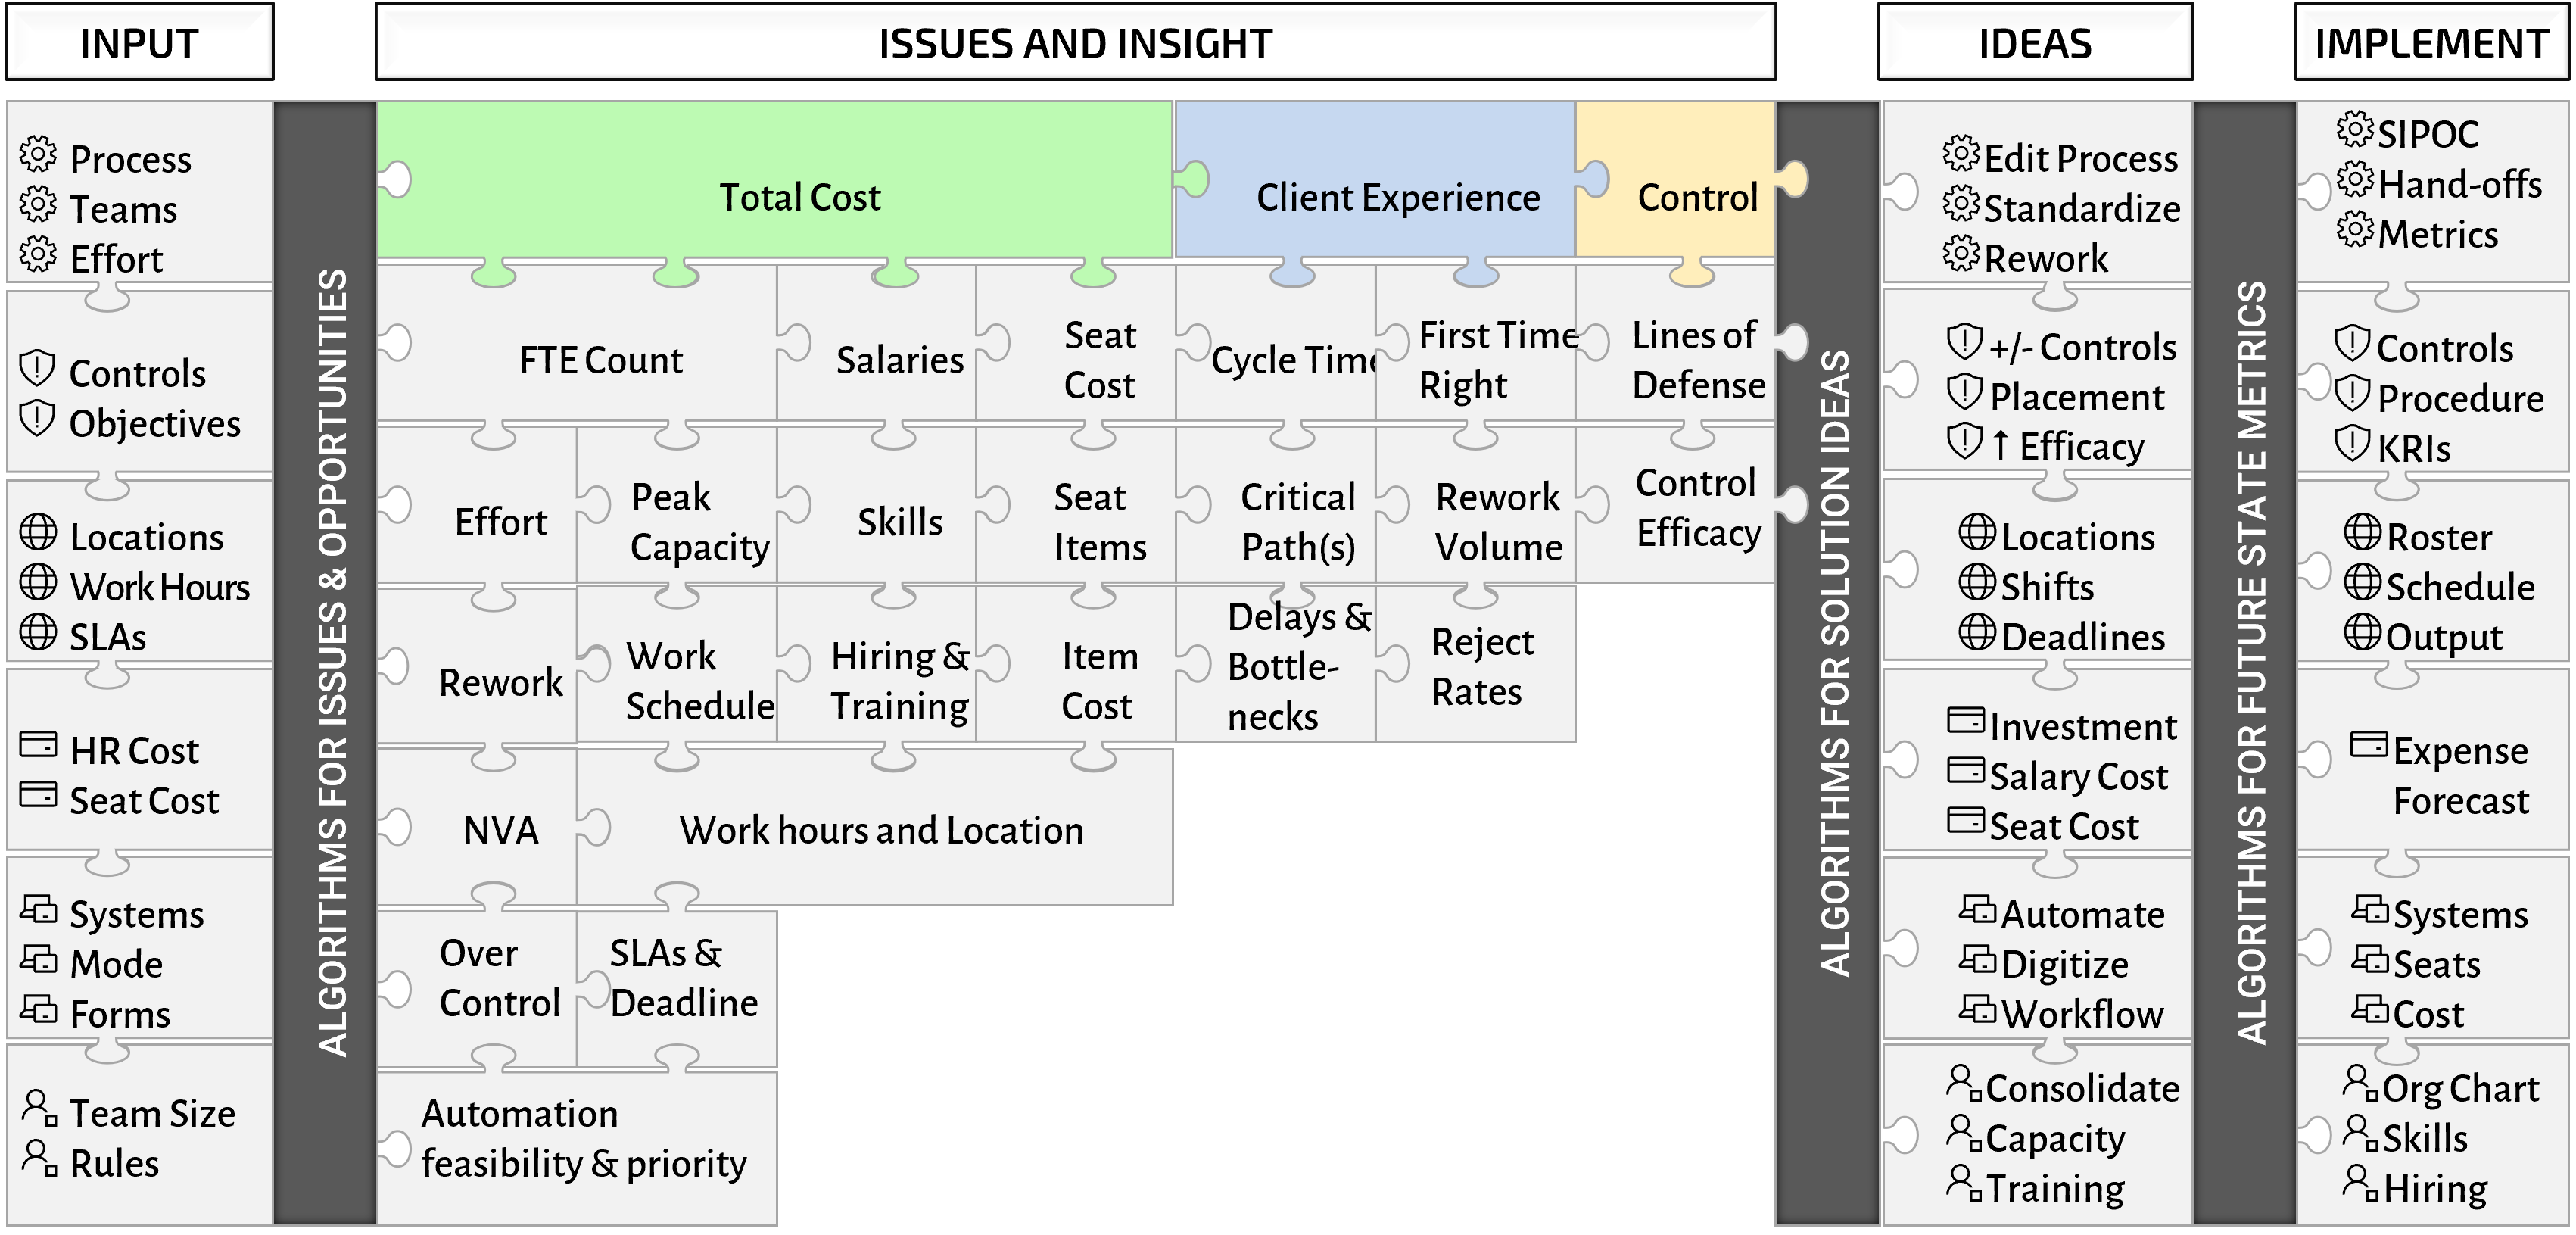
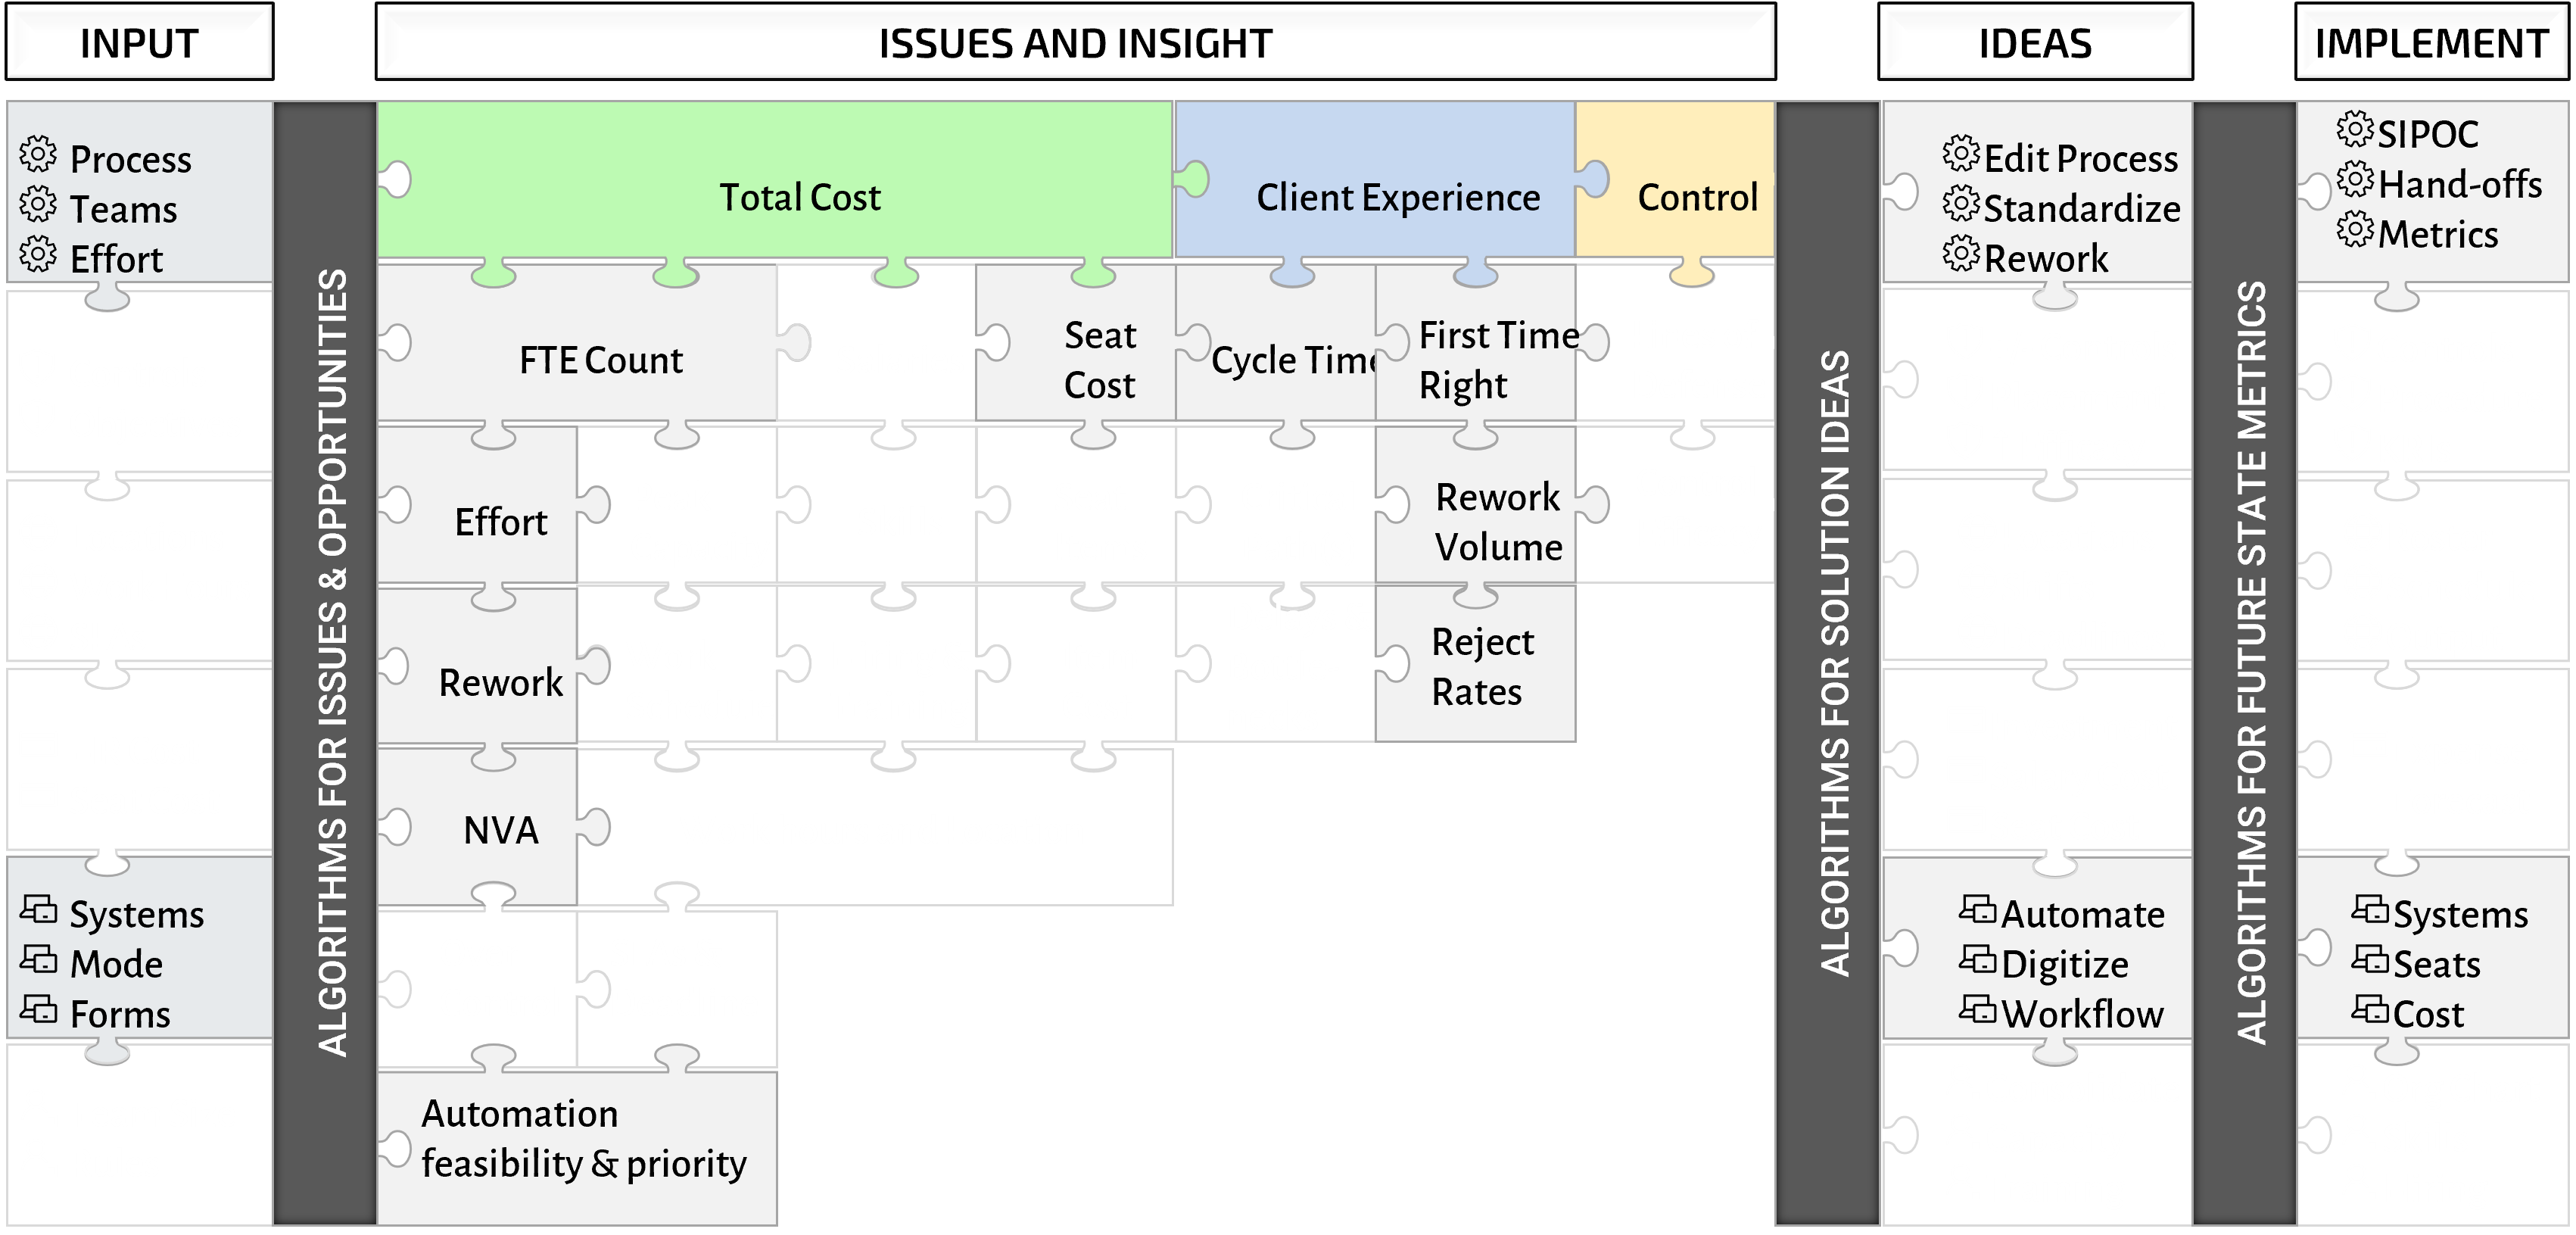
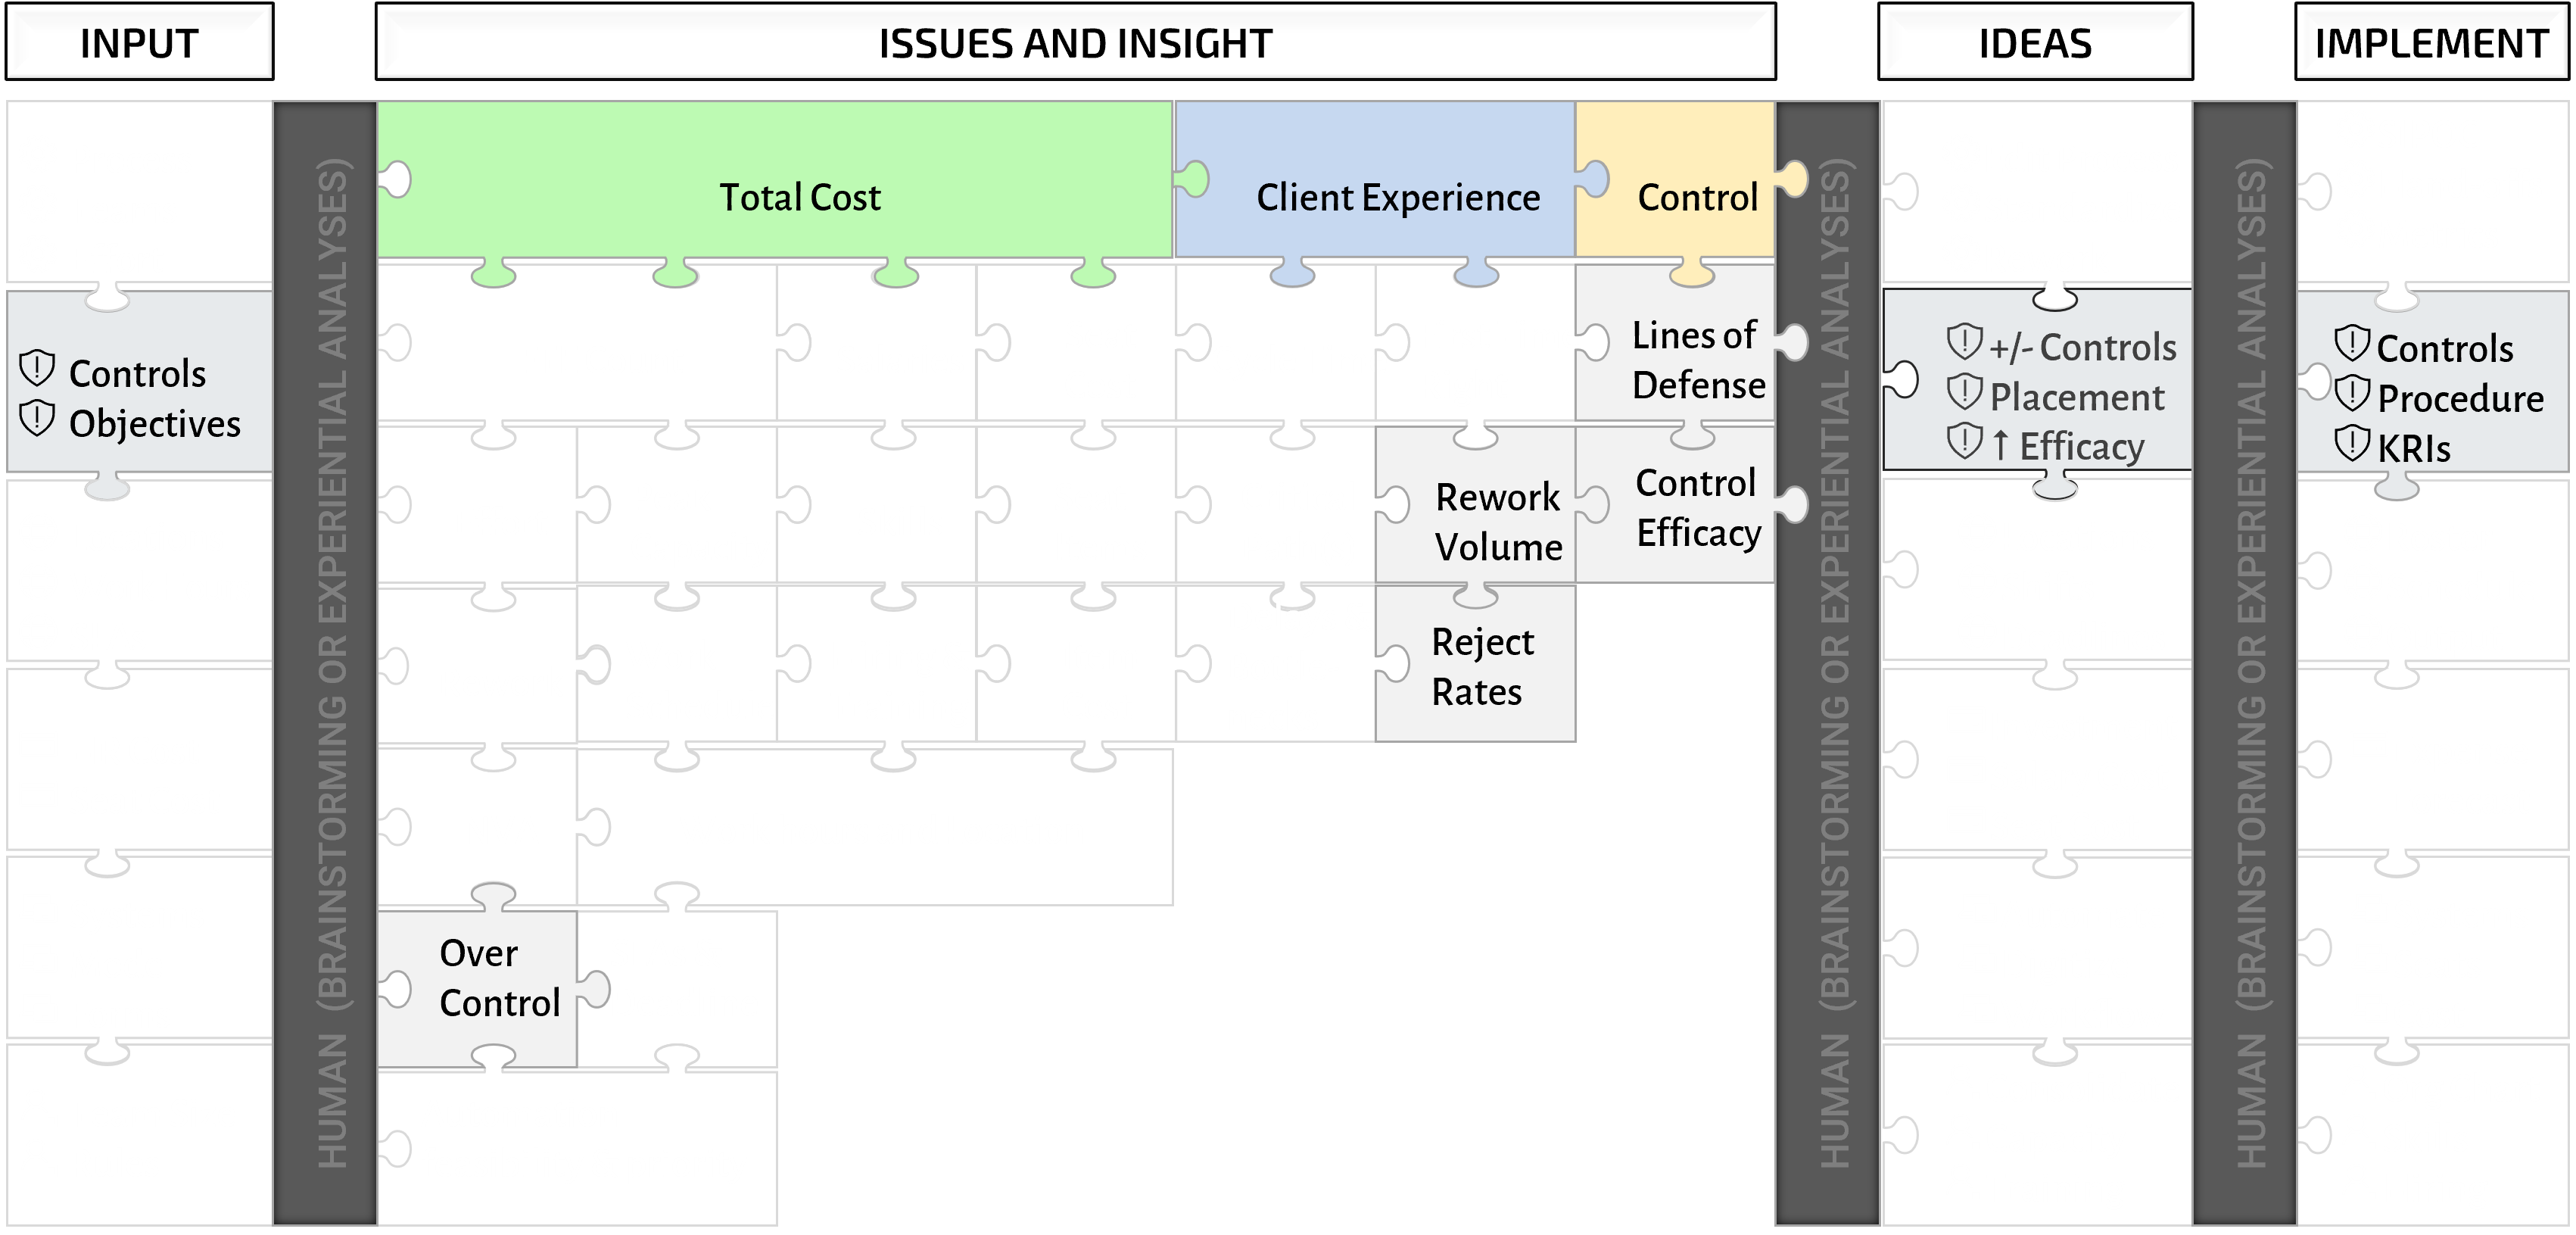
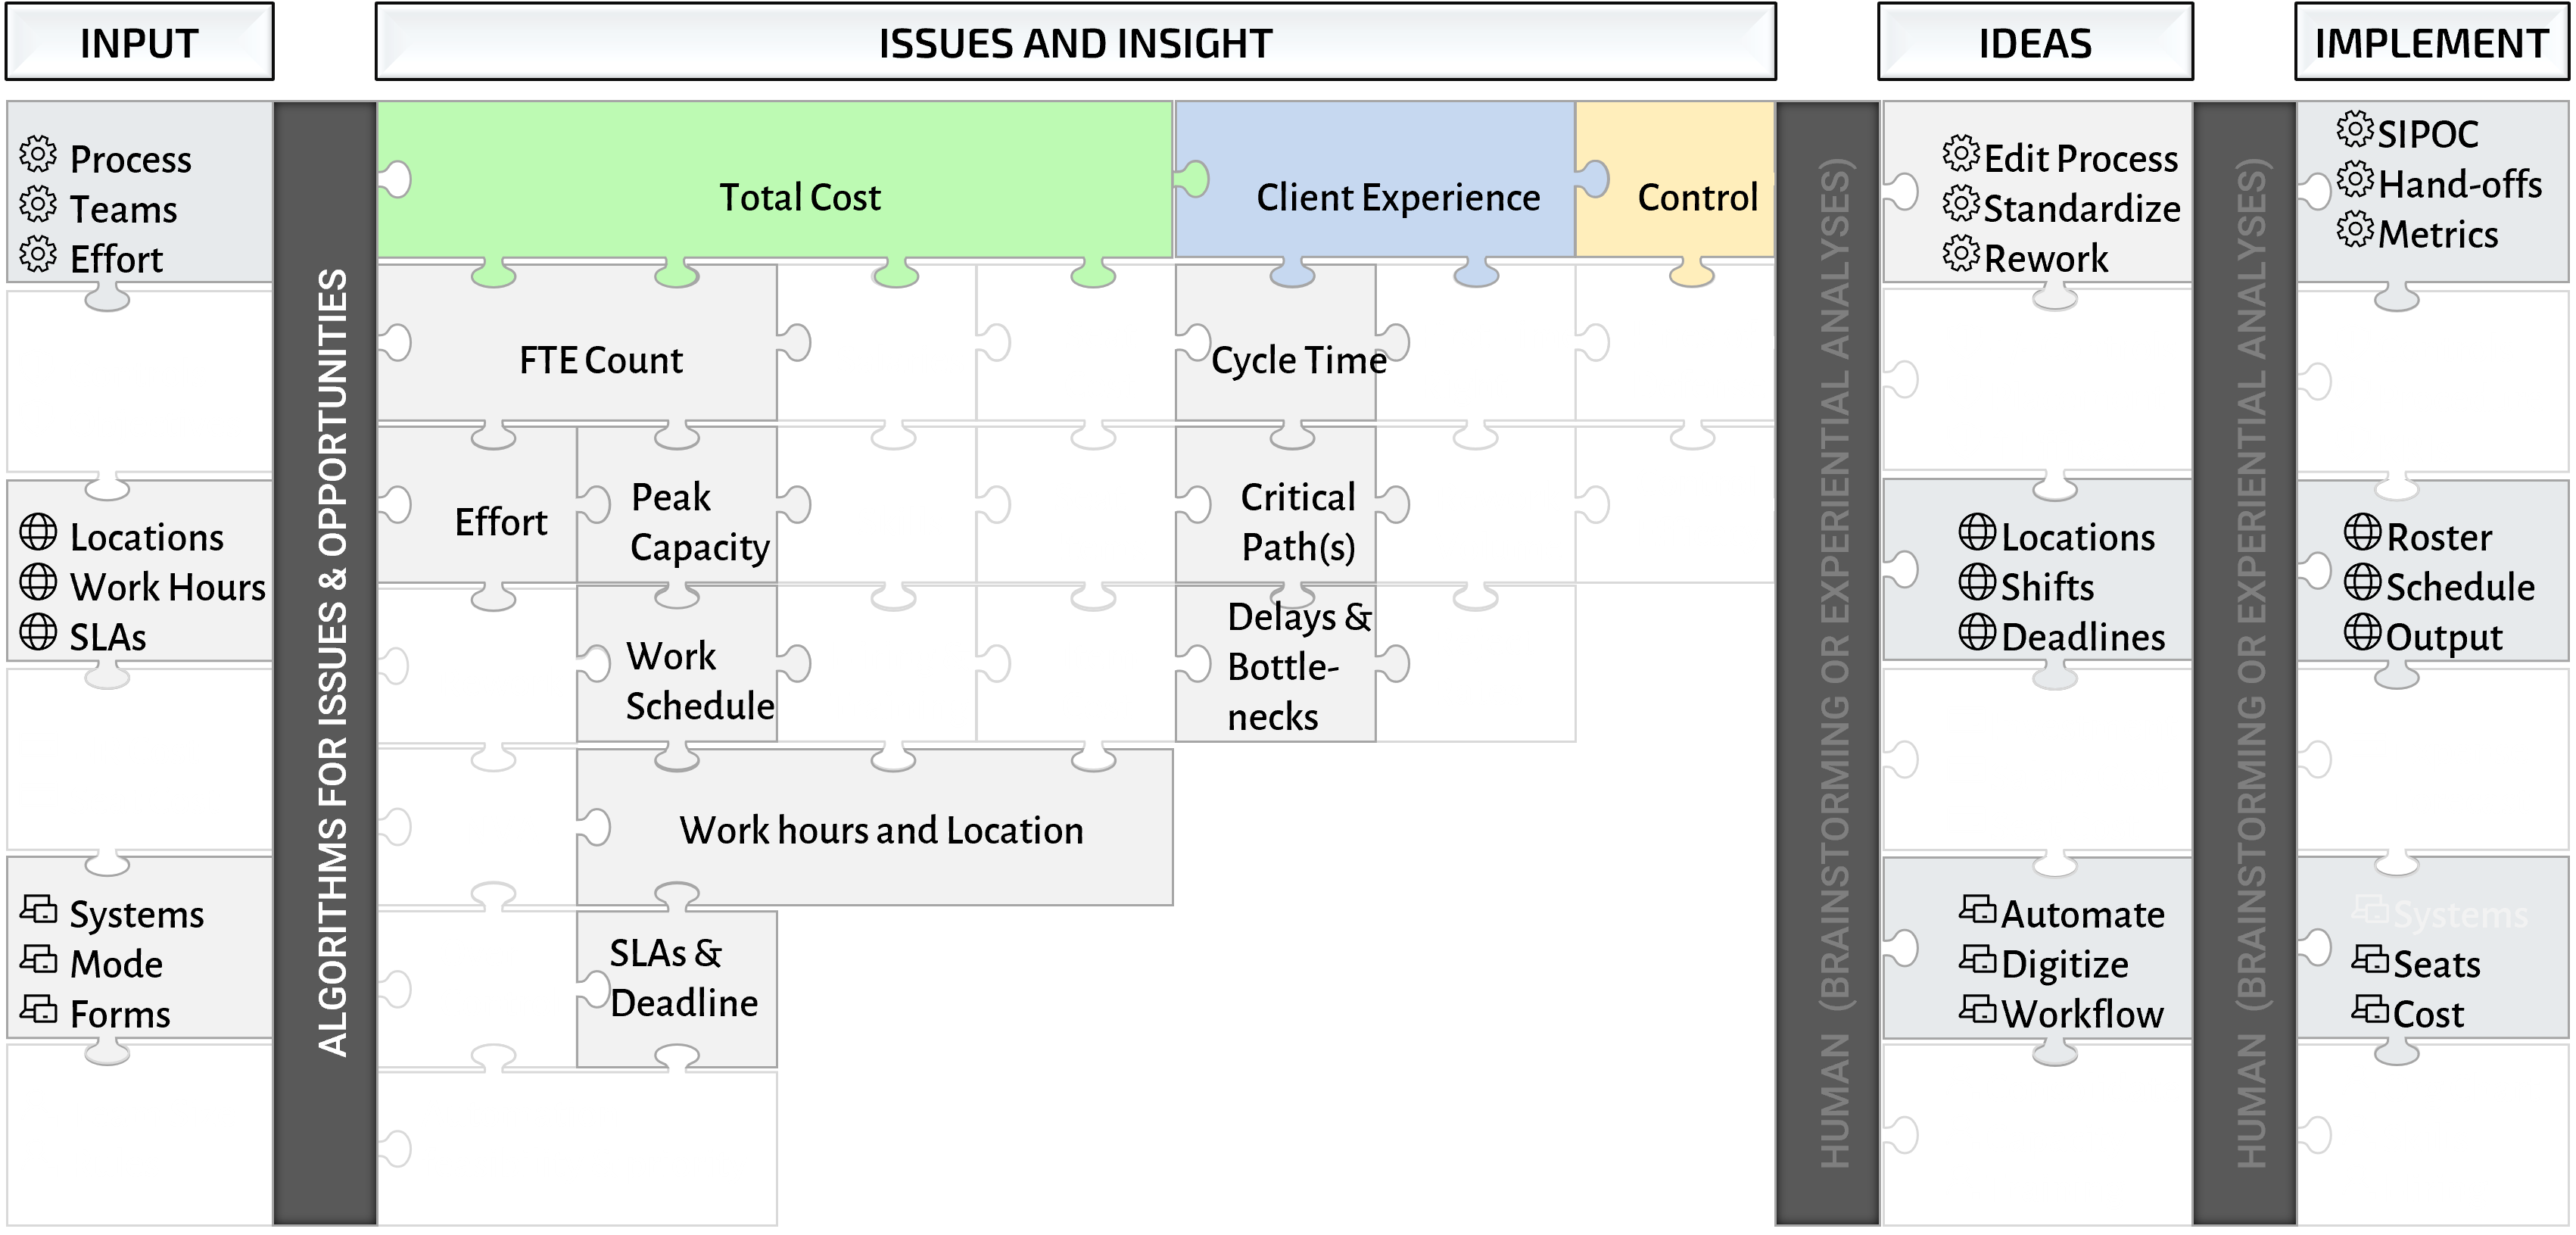
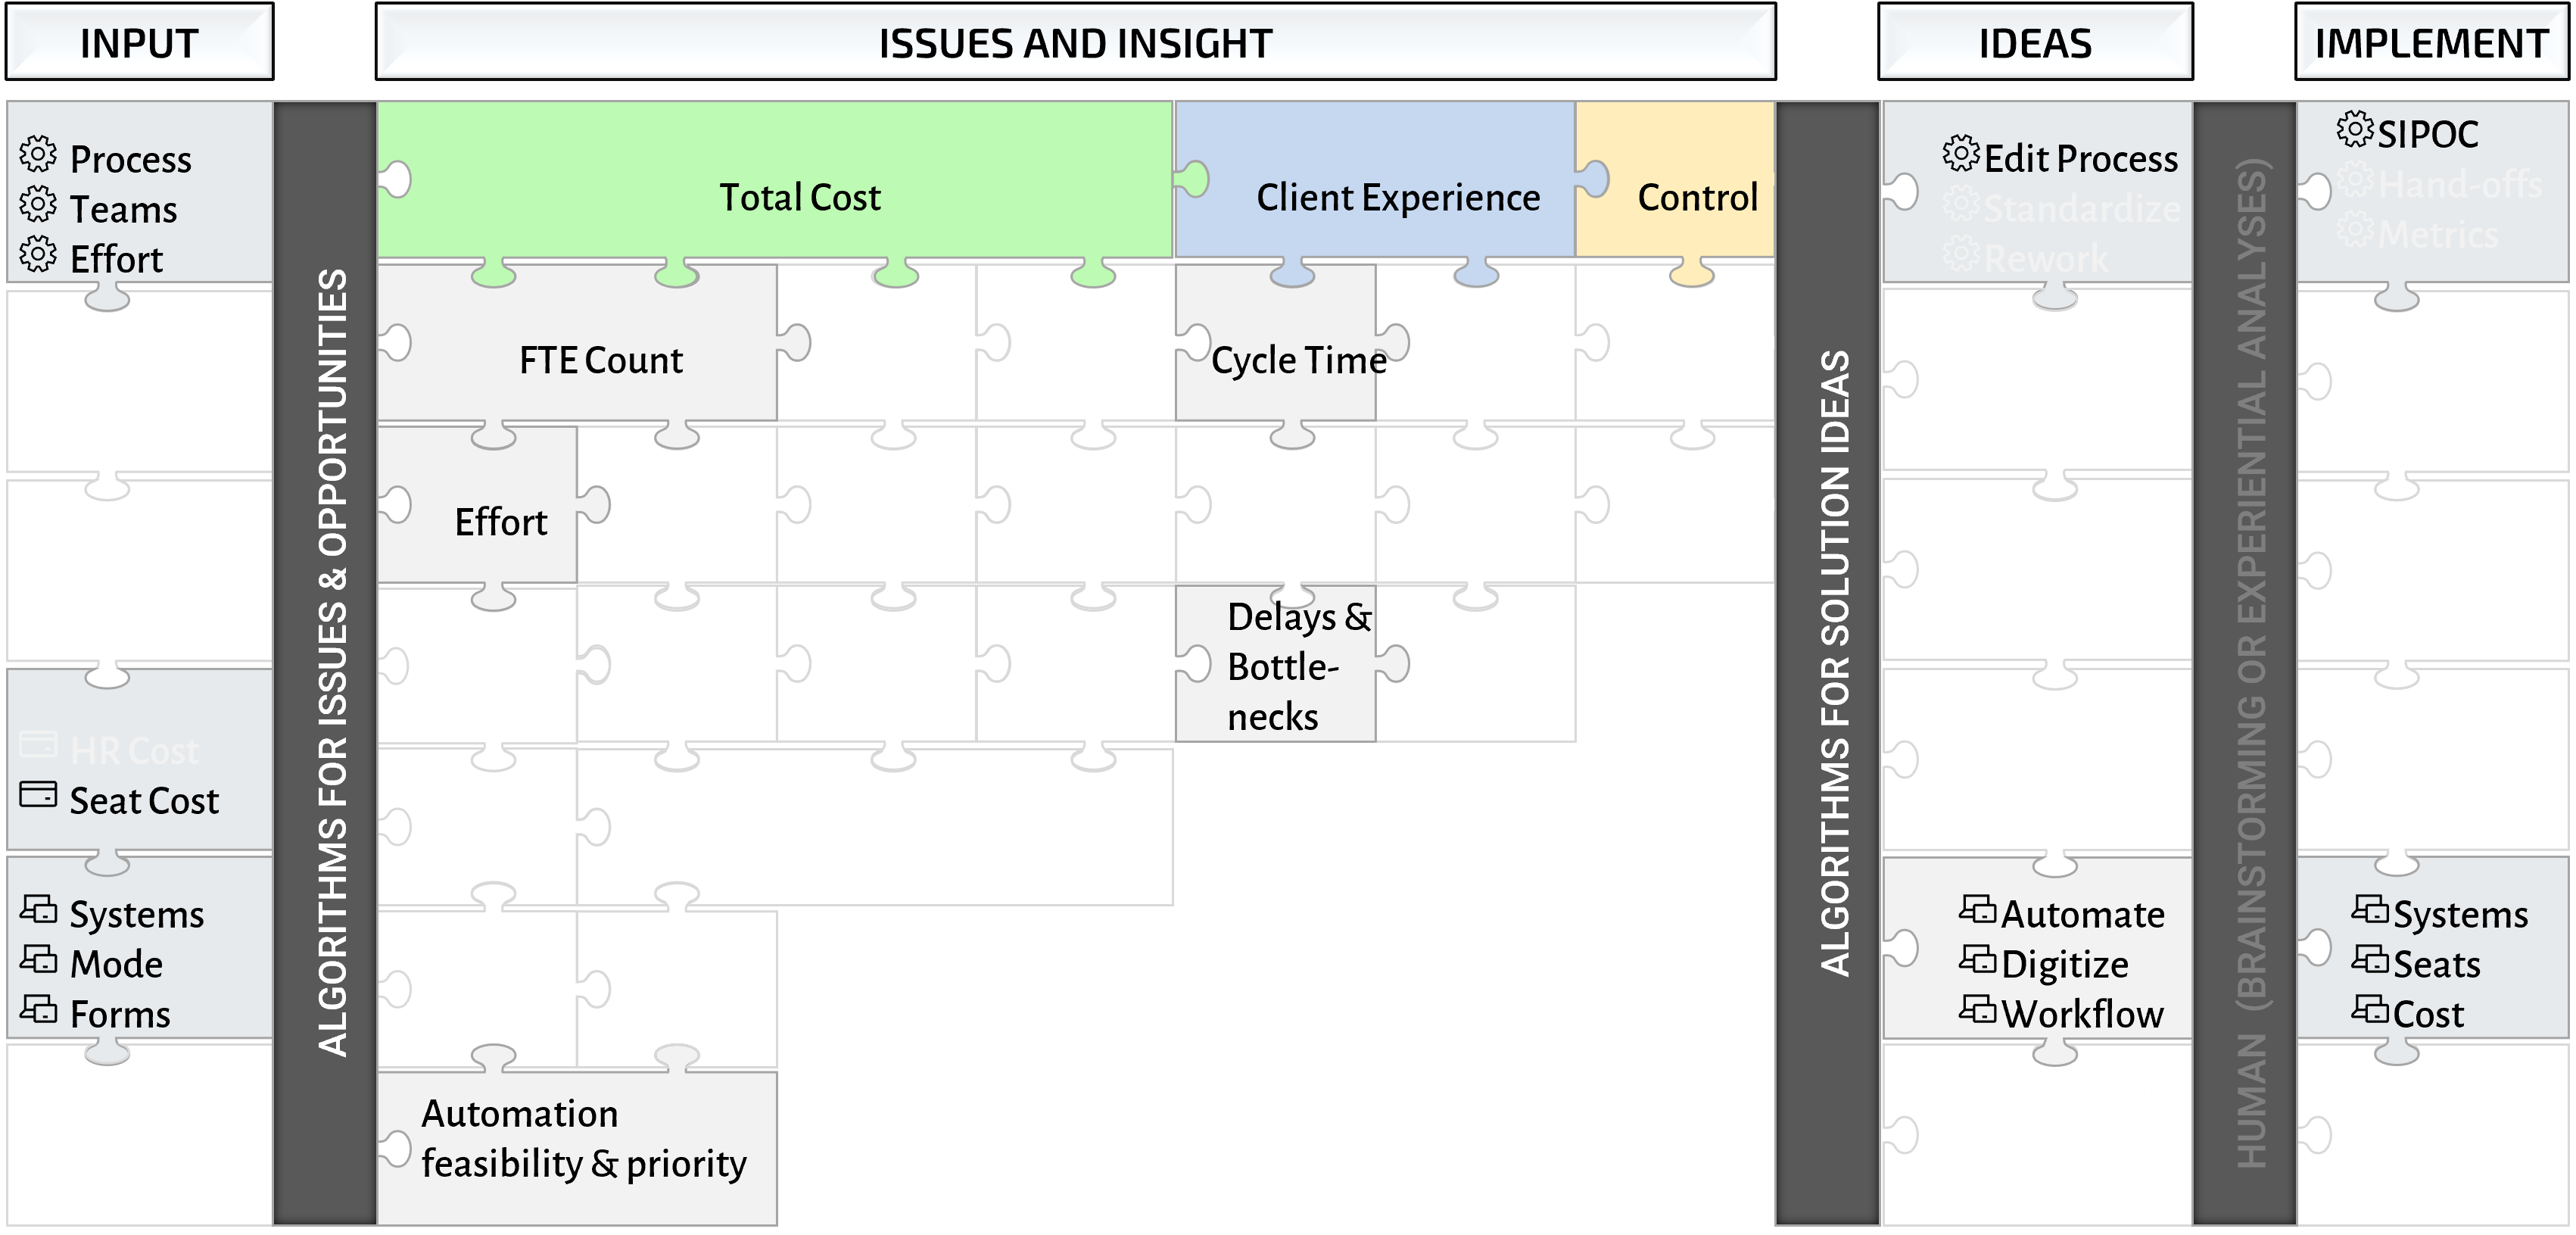
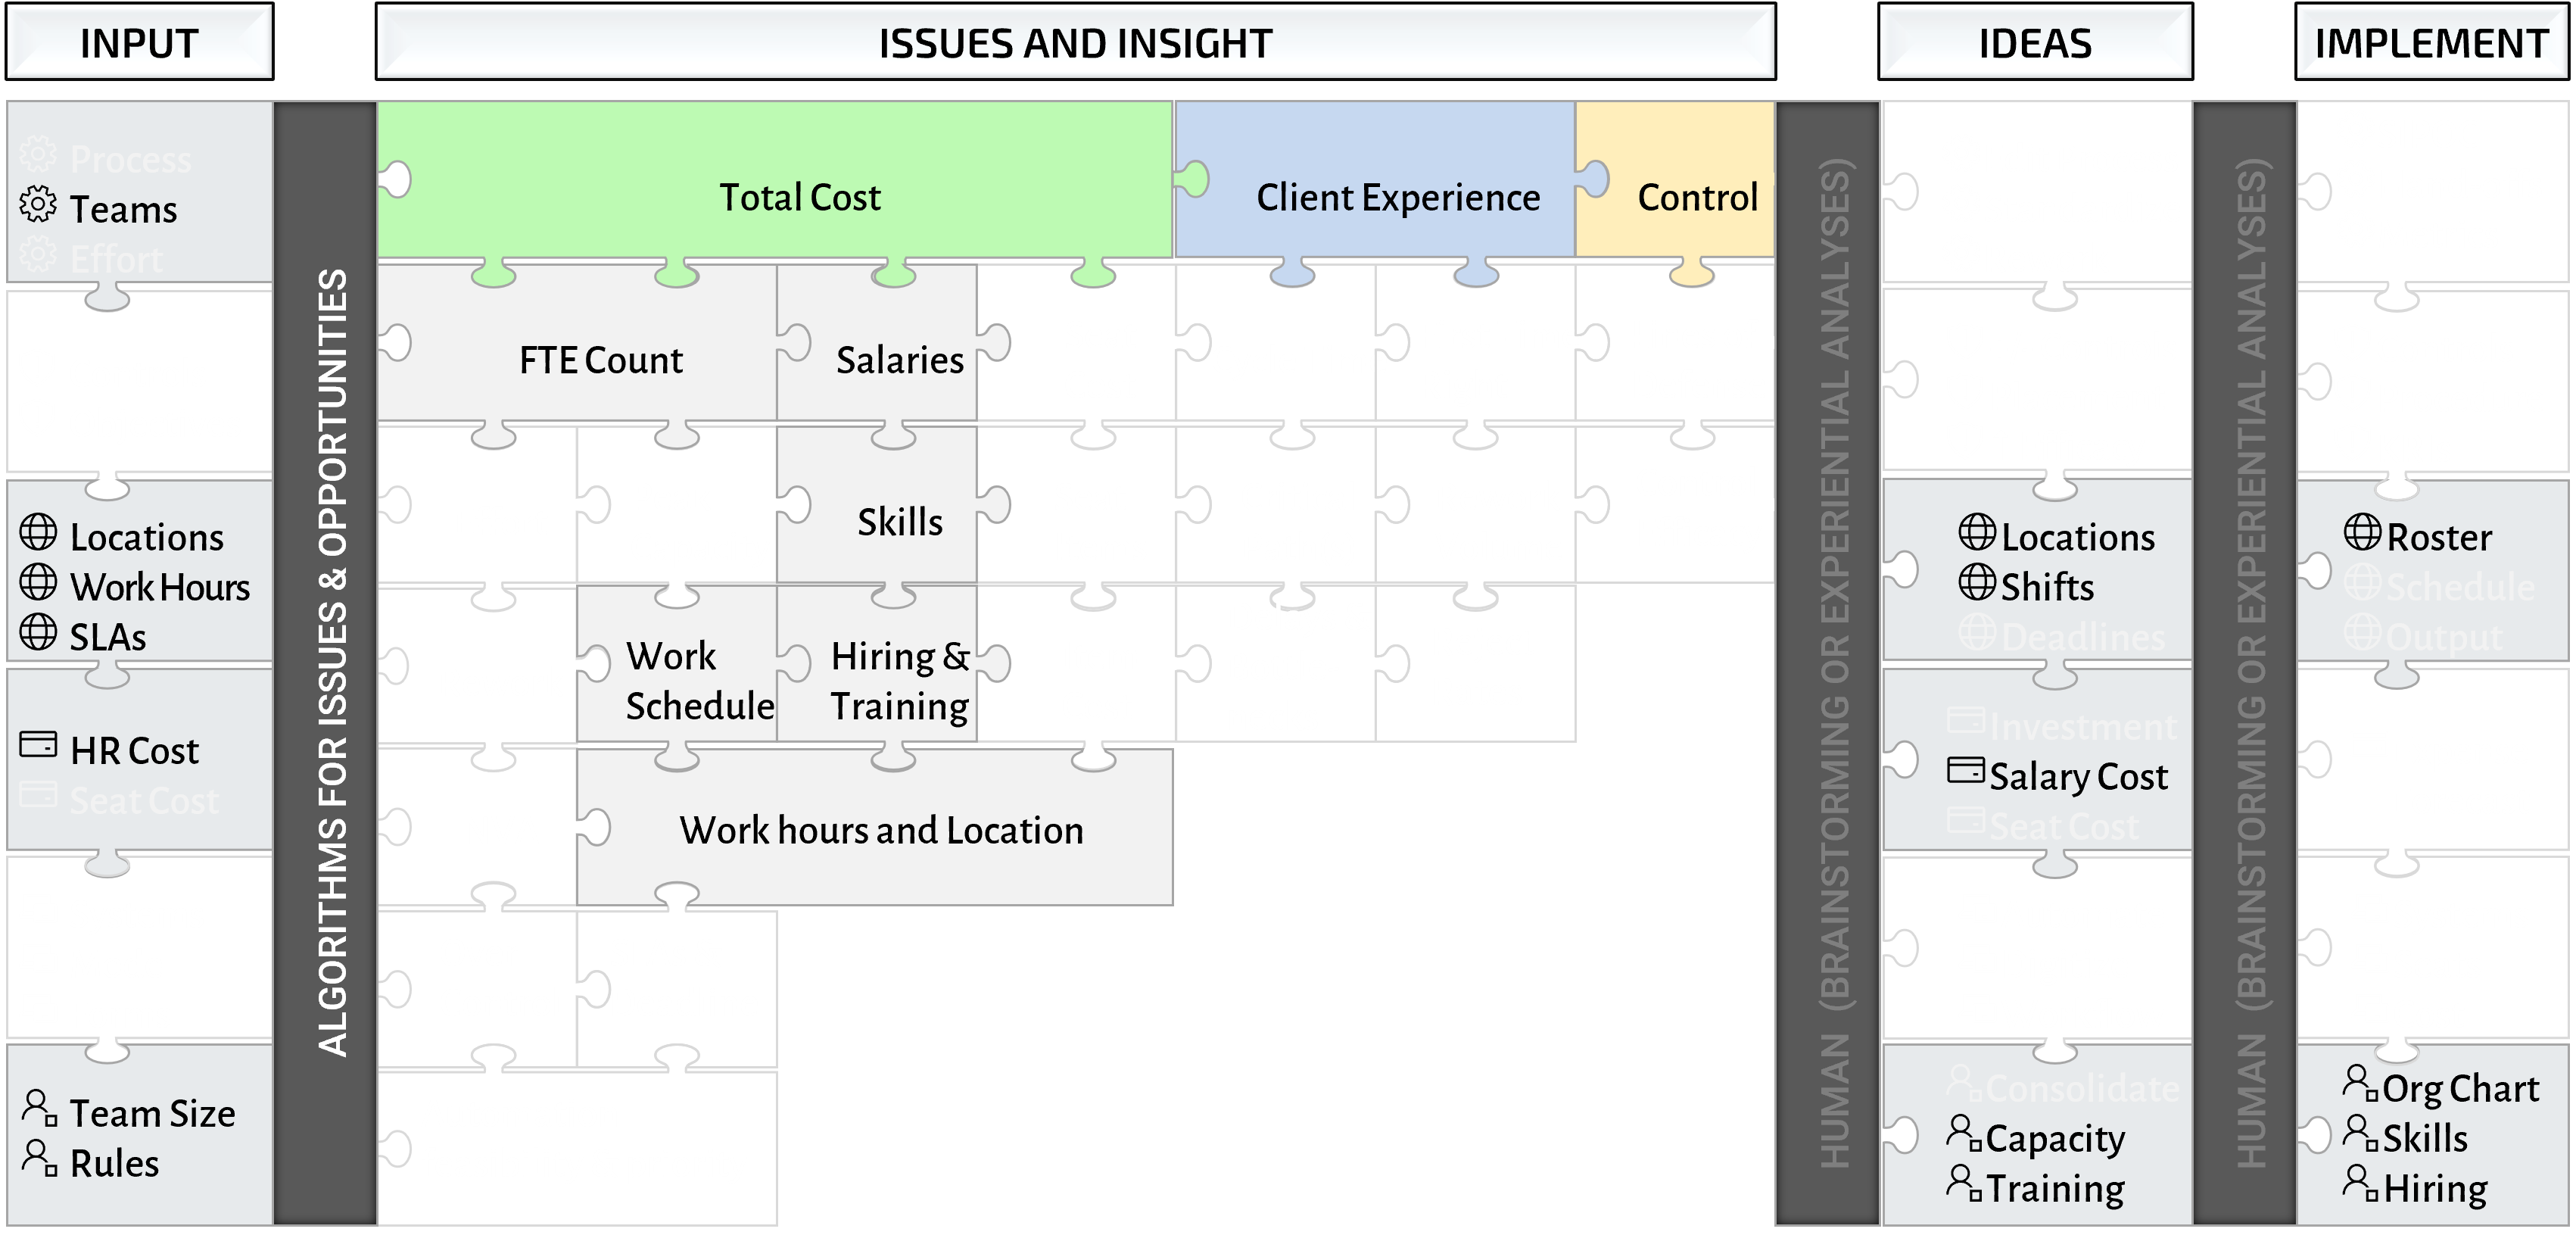
Identifies all issues and suggests all ideas for optimization that would otherwise get missed out with single objective or a single operations lever at a time.
Structured process for information, analysis and the power of computing generates the 360-degree view of the operations to finds the best idea to resolve the selected metrics.
Coordinated and prioritized implementation plan and view of future state metrics that considers all ideas and minimizes risk of stalled initiatives or undesired outcomes.
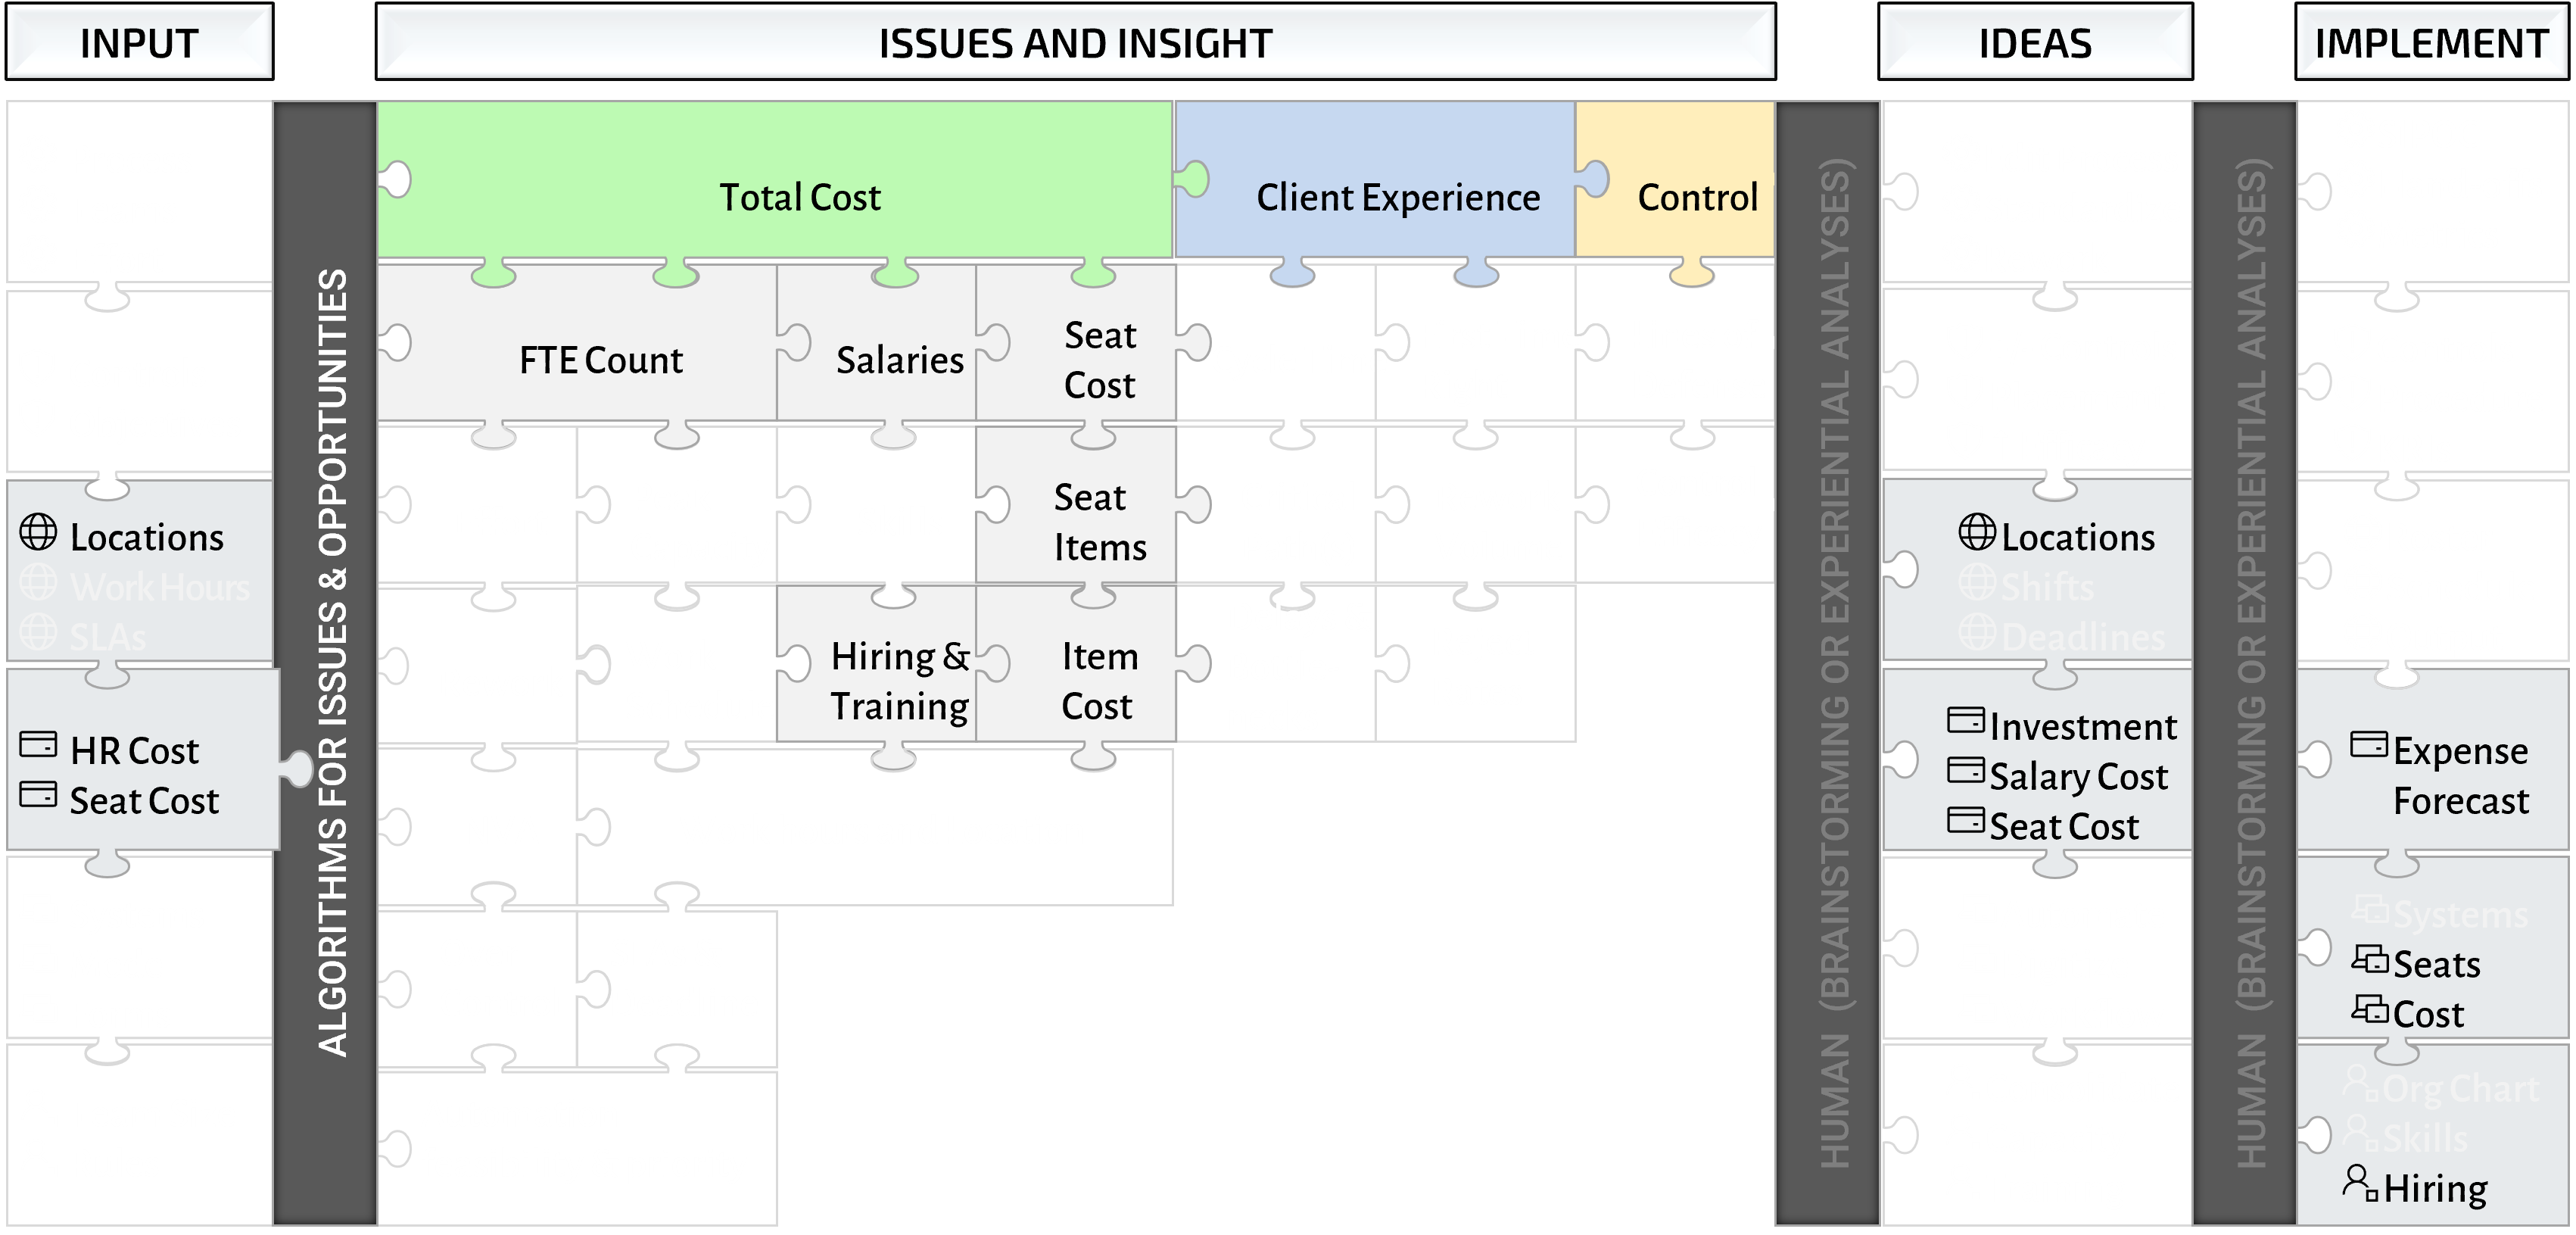
Suggests all ideas required to meet objectives
Suggests all ideas required to meet objectives
Mitigates unintended consequences